The SAVE Act Could Disenfranchise Millions of American Citizens: Passport Data Shows How
The SAVE Act Makes Registering or Re-Registering to Vote Needlessly Challenging
In January 2024, Rep. Chip Roy (TX-21) re-introduced the SAVE Act in the U.S. House of Representatives, a bill that would create new, onerous requirements for voter registration, effectively eliminate voter registration by mail, and upend online voter registration. The bill would undermine the National Voter Registration Act, a decades-old statute designed to ensure access to voter registration for those legally entitled to vote. The SAVE Act would instead force every voter to provide proof of citizenship, such as a passport or birth certificate, every time they register or update their voter registration – and to do so in person. Its provisions would cripple online and mail-in voter registration processes.
The SAVE Act provides a solution in search of a problem. There is no widespread voter fraud and non-citizens are already prohibited from voting. Worse still, the legislation would actually cause significant harm to American citizens’ right to vote. These new, difficult requirements would affect Americans across the country, potentially disenfranchising millions.
Passport Ownership Could Suddenly be Critical for Voting, But Rates Are Low
Under the SAVE Act, because voters would need to provide proof of citizenship every time they register or re-register, passport ownership would become critical. But passports are not required for day-to-day functions, and while many Americans hold passports, they are nowhere near universal and are, moreover, not easily accessible, with application fees of $165 and up. About half of all American adults – nearly 150 million U.S. citizens – do not have a passport, and older Americans are less likely to have a passport than younger citizens. Nationwide, the bill would also disproportionately impact military voters, rural voters, tribal citizens, survivors of natural disasters, working-class Americans, and the tens of millions of married women who have changed their names.
Congressional Districts With Low Rates of Passport Ownership Are Predominantly Held by Republicans
As the Center for American Progress has found, states with high rates of passport ownership are more commonly blue states, while states with low rates of passport ownership are overwhelmingly concentrated in red states. Similarly, districts with the lowest rates of passport ownership are more likely to be in southern states and held by Republican members of Congress, while districts with the highest rates of passport ownership are more likely to be in coastal states and held by Democratic members. For instance, every one of the ten districts with the lowest passport rates across the United States is in the South, and eight of the ten are currently held by Republican members of Congress. Meanwhile, nine of the ten districts with the highest rates of passport ownership are held by Democratic members of Congress (and the sole Republican-held district in this set, California’s 40th district, is a competitive district). Six of the ten are in California, with the rest coming from Massachusetts, New York, and Virginia.
Only About Half of Voting-Age Adults Have Passports in Competitive Districts
Only about half of voting-age adults hold passports in a number of congressional districts that had competitive races in 2024. In these districts, where elections were won or lost by thin margins, the SAVE Act’s widescale disenfranchisement efforts will have significant effects.
In Wisconsin’s 3rd congressional district, for example, where the incumbent congressman won by less than 12,000 votes, less than half (48.73%) of the district’s adults hold passports. The same is true in Iowa’s 1st congressional district, which the incumbent won in 2024 by less than 800 votes. In that district, only 48.99% of the district’s estimated 621,120 voting-age adults hold a valid passport; The remaining residents of voting age in the district—over 320,000 in total—could face significant registration barriers in future elections if the SAVE Act is implemented. And many other competitive districts have similarly low passport rates, including Iowa’s 3rd congressional district (52.35%), Michigan’s 7th (53.97%) and 10th (52.3%), and Nebraska’s 2nd (55.98%). In California’s 22nd district, a central valley district where the incumbent prevailed by less than 12,000 votes in 2024, only 50.27% of those of voting age who live in the district have passports.
Across the country, only about one in two of those old enough to vote in many competitive districts are likely to have a valid passport. That means that in districts where the tiniest of margins could swing an election, nearly half of the district’s adults could suddenly lack the ability to register to vote.
“METHODOLOGY”
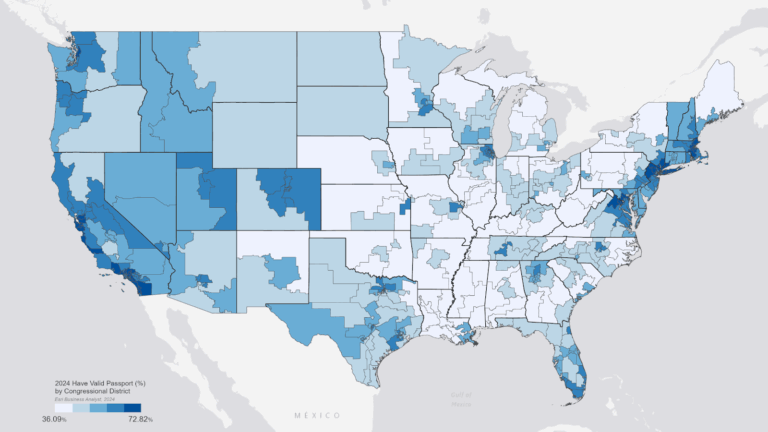
The below map and table were generated by the NRF using data from Esri Business Analyst at the census block group level aggregated to congressional districts. The passport data is from 2024, and the congressional districts reflect the current congressional map following several mid-decade changes.
Map of Adult Passport Ownership (2024)
The full report is available for download here.
Ensure Every Voice Counts
The National Redistricting Foundation works to advance fair representation, so voters—not political interests—shape our democracy.